Syllabus
Introduction to Data Science
Instructor Info
Lectures
- Time: TBD Room: TBD
Instructor
- Dr. Fatih Uenal Old Cavendish Laboratory
- Office hours: by appointment
- fu212@cam.ac.uk
Course Objectives
This interactive course introduces concepts and skills that can help you tackle real-world data analysis challenges. The course covers concepts such as inference, probability, regression, and machine learning and helps you develop an essential skill set that includes R programming, data wrangling with dplyr, data visualization with ggplot2, file organization with Unix/Linux, version control with git and GitHub, and reproducible document preparation with RStudio.
At the end of this course you will:
Possess the fundamental R programming skills
Have a good understanding of statistical concepts such as probability, inference, and modelling and how to apply them in practice
Gain experience with the tidyverse, including data visualization with ggplot2 and data wrangling with dplyr
Become familiar with essential tools for practising data scientists such as Unix/Linux, git and GitHub, and RStudio
Have implemented the most common machine learning algorithms
Gain in-depth knowledge of fundamental data science concepts through motivating real-world case studies
NOTE: The schedule and procedures described in this syllabus are subject to change depending on specific needs and requirements. You will always be notified of changes on the homepage (see “last update”).
datsci Interactive tutorials Overview
datsci_00: Introduction to Data Science Course: Course structure, syllabus, grading, and workflow.
This short Module will get you started with R and RStudio. Here, we will introduce you the to the course structure and provide all necessary information for you to successfully complete the series.
datsci_01: R Basics: Build a foundation in R and learn how to wrangle, analyze, and visualize data.
The first in the Introduction to Data Science Series (datsci_01), this course will introduce you to the basics of R programming. You can better retain R when you learn it to solve a specific problem, so you’ll use a real-world dataset about crime in the United States. You will learn the R skills needed to answer essential questions about differences in crime across the different states.
We’ll cover R’s functions and data types, then tackle how to operate on vectors and when to use advanced functions like sorting. You’ll learn how to apply general programming features like “if-else,” and “for loop” commands, and how to wrangle, analyse and visualize data. Rather than covering every R skill you might need, you’ll build a strong foundation to prepare you for the more in-depth courses later in the series, where we cover concepts like probability, inference, regression, and machine learning. We help you develop a skill set that includes R programming, data wrangling with dplyr, data visualization with ggplot2, file organization with UNIX/Linux, version control with git and GitHub, and reproducible document preparation with RStudio.
Basic R syntax
Foundational R programming concepts such as data types, vectors arithmetic, and indexing
How to perform operations in R including sorting, data wrangling using dplyr, and making plots
datsci_02: Data Visualization: Learn basic data visualization principles and how to apply them using ggplot2.
The is the second course in the Introduction to Data Science (datsci_02), this course covers the basics of data visualization and exploratory data analysis. We will use three motivating examples and ggplot2, a data visualization package for the statistical programming language R. We will start with simple datasets and then graduate to case studies about world health, economics, and infectious disease trends in the United States.
We’ll also be looking at how mistakes, biases, systematic errors, and other unexpected problems often lead to data that should be handled with care. The fact that it can be difficult or impossible to notice a mistake within a dataset makes data visualization particularly important.
The growing availability of informative datasets and software tools has led to increased reliance on data visualizations across many areas. Data visualization provides a powerful way to communicate data-driven findings, motivate analyses, and detect flaws. This course will give you the skills you need to leverage data to reveal valuable insights and enhance your analytical skills.
Data visualization principles
How to communicate data-driven findings
How to use ggplot2 to create custom plots
The weaknesses of several widely used plots and why you should avoid them
datsci_03: Probability: Learn probability theory – essential for a data scientist – using a case study on the financial crisis of 2007-2008.
In this course, the third part of Introduction to Data Science (datsci_03), you will learn foundational concepts in probability theory. The motivation for this course is the circumstances surrounding the financial crisis of 2007-2008. Part of what caused this financial crisis was that the risk of some securities sold by financial institutions was underestimated. To begin to understand this very complicated event, we need to understand the basics of probability. We will introduce important concepts such as random variables, independence, Monte Carlo simulations, expected values, standard errors, and the Central Limit Theorem. These statistical concepts are fundamental to conducting statistical tests on data and understanding whether the data you are analysing is likely occurring due to an experimental method or to chance. Probability theory is the mathematical foundation of statistical inference, which is indispensable for analysing data affected by chance, and thus essential for data scientists.
Important concepts in probability theory including random variables and independence
How to perform a Monte Carlo simulation
The meaning of expected values and standard errors and how to compute them in R
datsci_04: Inference and Modeling: Learn inference and modeling, two of the most widely used statistical tools in data analysis.
Statistical inference and modelling are indispensable for analysing data affected by chance, and thus essential for data scientists. In this course, the fourth part, you will learn these key concepts through a motivating case study on election forecasting.
This course will show you how inference and modelling can be applied to develop the statistical approaches that make polls an effective tool and we’ll show you how to do this using R. You will learn concepts necessary to define estimates and margins of errors and learn how you can use these to make predictions relatively well and also provide an estimate of the precision of your forecast.
Once you learn this you will be able to understand two concepts that are ubiquitous in data science: confidence intervals, and p-values. Then, to understand statements about the probability of a candidate winning, you will learn about Bayesian modelling. Finally, at the end of the course, we will put it all together to recreate a simplified version of an election forecast model and apply it to the 2016 election.
The concepts necessary to define estimates and margins of errors of populations, parameters, estimates and standard errors in order to make predictions about data
How to use models to aggregate data from different sources
The very basics of Bayesian statistics and predictive modelling
datsci_05: Productivity Tools: Keep your projects organized and produce reproducible reports using GitHub, git, Unix/Linux, and RStudio.
A typical data analysis project may involve several parts, each including several data files and different scripts with code. Keeping all this organized can be challenging.
Part five of the Introduction to Data Science Series (datsci_05), this course explains how to use Unix/Linux as a tool for managing files and directories on your computer and how to keep the file system organized. You will be introduced to the version control systems git, a powerful tool for keeping track of changes in your scripts and reports. We also introduce you to GitHub and demonstrate how you can use this service to keep your work in a repository that facilitates collaborations.
Finally, you will learn to write reports in R markdown which permits you to incorporate text and code into a document. We’ll put it all together using the powerful integrated desktop environment RStudio.
How to use Unix/Linux to manage your file system
How to perform version control with git
How to start a repository on GitHub
How to leverage the many useful features provided by RStudio
datsci_06: Wrangling: Learn to process and convert raw data into formats needed for analysis.
In this course, the sixth part of the Introduction to Data Science Series (datsci_06), we cover several standard steps of the data wrangling process like importing data into R, tidying data, string processing, HTML parsing, working with dates and times, and text mining. Rarely are all these wrangling steps necessary in a single analysis, but a data scientist will likely face them all at some point.
Very rarely is data easily accessible in a data science project. It’s more likely for the data to be in a file, a database, or extracted from documents such as web pages, tweets, or PDFs. In these cases, the first step is to import the data into R and tidy the data, using the tidyverse package. The steps that convert data from its raw form to the tidy form is called data wrangling.
This process is a critical step for any data scientist. Knowing how to wrangle and clean data will enable you to make critical insights that would otherwise be hidden.
Importing data into R from different file formats
Web scraping
How to tidy data using the tidyverse to better facilitate analysis
String processing with regular expressions (regex)
Wrangling data using dplyr
datsci_07: Linear Regression: Learn how to use R to implement linear regression, one of the most common statistical modeling approaches in data science.
Linear regression is commonly used to quantify the relationship between two or more variables. It is also used to adjust for confounding. This course, part seven of the Introduction to Data Science Series (datsci_07), covers how to implement linear regression and adjust for confounding in practice using R.
In data science applications, it is very common to be interested in the relationship between two or more variables. The motivating case study we examine in this course relates to the data-driven approach used to construct baseball teams described in Moneyball. We will try to determine which measured outcomes best predict baseball runs by using linear regression. We will also examine confounding, where extraneous variables affect the relationship between two or more other variables, leading to spurious associations. Linear regression is a powerful technique for removing confounders, but it is not a magical process. It is essential to understand when it is appropriate to use, and this course will teach you when to apply this technique.
How linear regression was originally developed by Galton
What is confounding and how to detect it
How to examine the relationships between variables by implementing linear regression in R
datsci_08: Machine Learning: Build a movie recommendation system and learn the science behind one of the most popular and successful data science techniques.
Perhaps the most popular data science methodologies come from machine learning. What distinguishes machine learning from other computer guided decision processes is that it builds prediction algorithms using data. Some of the most popular products that use machine learning include the handwriting readers implemented by the postal service, speech recognition, movie recommendation systems, and spam detectors.
In this course, the eighth part of the Introduction to Data Science Series (datsci_08), you will learn popular machine learning algorithms, principal component analysis, and regularization by building a movie recommendation system.
You will learn about training data, and how to use a set of data to discover potentially predictive relationships. As you build the movie recommendation system, you will learn how to train algorithms using training data so you can predict the outcome for future datasets. You will also learn about overtraining and techniques to avoid it such as cross-validation. All of these skills are fundamental to machine learning.
The basics of machine learning
How to perform cross-validation to avoid overtraining
Several popular machine learning algorithms
How to build a recommendation system
What is regularization and why it is useful?
Textbook (freely available)
The reading materials for this course are entirely based on the textbook Introduction to Data Science by Prof Rafael Irizarry and follows the structure of the associated edX course HarvardX Professional Certificate in Data Science.
- Irizarry, R. (2019). Introduction to Data Science. Data Analysis and Prediction Algorithms with R. eBook available at https://rafalab.github.io/dsbook/
Additional resources
Supplementary materials will be posted on the course website. For example, check out the resources page on this website.
Navarro, D. (2019). Learning statistics with R: A tutorial for psychology students and other beginners. (Version 0.6.1, June 19, 2019). Danielle Navarro (bookdown translation: Emily Kothe) eBook available at https://learningstatisticswithr.com/book/
Neth, H. (2020). Data Science for Psychologists. Social Psychology and Decision Sciences, University of Konstanz, Germany. Textbook and R package ds4psy (version 0.2.1, May 6, 2020). eBook available at https://bookdown.org/hneth/ds4psy/; R package at https://CRAN.R-project.org/package=ds4psy
Wickham, H. & Grolemund, G. (2017). R for Data Science Import, Tidy, Transform, Visualize, and Model Data. eBook available at https://r4ds.had.co.nz/
Field, A., Miles, J., & Field, Z. (2012). Discovering Statistics Using R. London, UK: Sage Publications.
Silge, J. & Robinson, D. (2017). Text Mining with R: A Tidy Approach. eBook available at https://www.tidytextmining.com/
Harrer, M., Cuijpers, P., Furukawa, T.A, & Ebert, D. D. (2019). Doing Meta-Analysis in R: A Hands-on Guide. eBook available at https://bookdown.org/MathiasHarrer/Doing_Meta_Analysis_in_R/.
Assessment and Evaluation:
DataCamp Lessons
Each Thursday, lessons will be assigned from datacamp.com. Some of these lessons will be complete DataCamp courses, and others will be specific modules of courses. This will all be managed by assigning content to your (free) DataCamp account. The amount of content assigned will vary between one and two courses of content. DataCamp considers a course to be roughly 4 hours of lessons, which includes practice time. Realistically, the time you need will depend upon how intuitive you find R to be. For students already familiar with other programming languages and those with previous R experience, “8 hours” of courses is realistically closer to 2 hours; for complete novices that also find the material difficult, 8 hours is a realistic estimate. It is strongly recommended that you stretch out DataCamp lessons across the assignment period, for example, allocating 1 hour each day between Thursday and Tuesday. You will gain the most by treating this as a foreign language immersion course by using R every day, including for your own research.
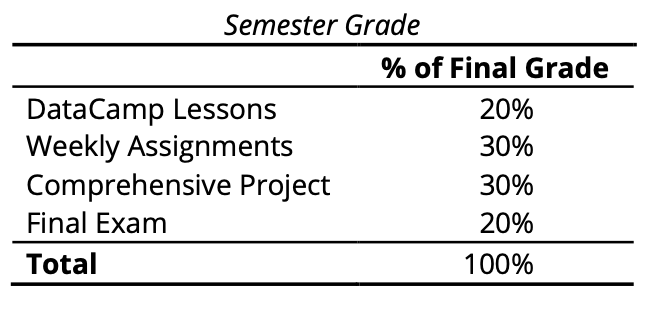
Weekly Assignments
Each Thursday, the previous week’s assignment, which is designed to test how well you can apply that week’s DataCamp lessons in combination with any material introduced Tuesday, will be due by 6 AM. In general, these assignments are designed to take less than 4 hours if you are on top of the DataCamp lessons, and the files you create should be submitted via Blackboard.
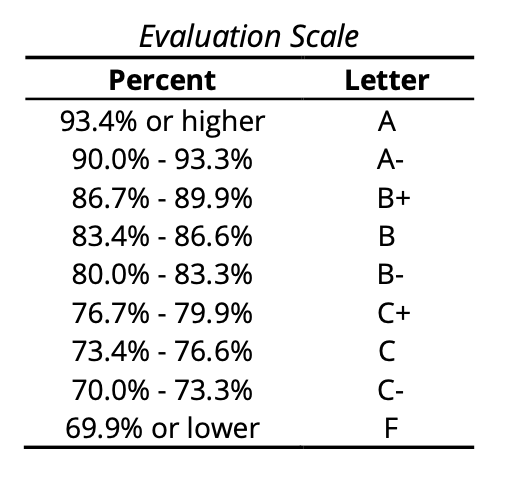
Grading (total of 100)
On Thursday of Week 14, a comprehensive project will be assigned integrating many of the skills learned over the previous 14 weeks. This will be due the last day of classes this semester, Month Day, at 11:59 PM. This project will be designed to mimic a research project, involving obtaining and importing data, processing it in a variety of requested ways, and creating several visualizations and output tables of the type that might be included in an APA-style paper. It will also include learning a new R package and using it correctly in your dataset, which assesses your ability to generalize lessons learned from the course content.
Final Exam
The final exam for this course is a 3-hour live coding session. This exam will test your ability to do basic coding tasks in a reasonable amount of time (of much less complexity than the kind you’ll demonstrate in the comprehensive project). You will be required to bring a laptop to the final exam and submit your final exam on Blackboard by the end of the exam period.
Attendance
LECTURE ATTENDANCE POLICY
LAB ATTENDANCE POLICY
Uni policy on Academic Integrity
Missing an Exam or class
Accessibility
Class Citizenship/Rules of Conduct
Cell phones
Your cell phone, PDA or other device must be turned off during class. If you are a habitual offender in this respect (i.e. it happens more than twice during the semester), you will be asked to leave the classroom. If you absolutely need to have your phone on during class—talk to me at the beginning of the semester.
Keep the room clean
Please pick up after yourself. Absolutely no food is allowed in the lecture and lab rooms.
Email Correspondence
I will regularly use e-mail to send out announcements, changes in the syllabus, reminders about tests or due dates, etc. It is your responsibility to check e-mail regularly to keep up-to-date with these announcements. I will use the e-mail address you have listed with the College. Therefore, please make sure that this is indeed the correct address.